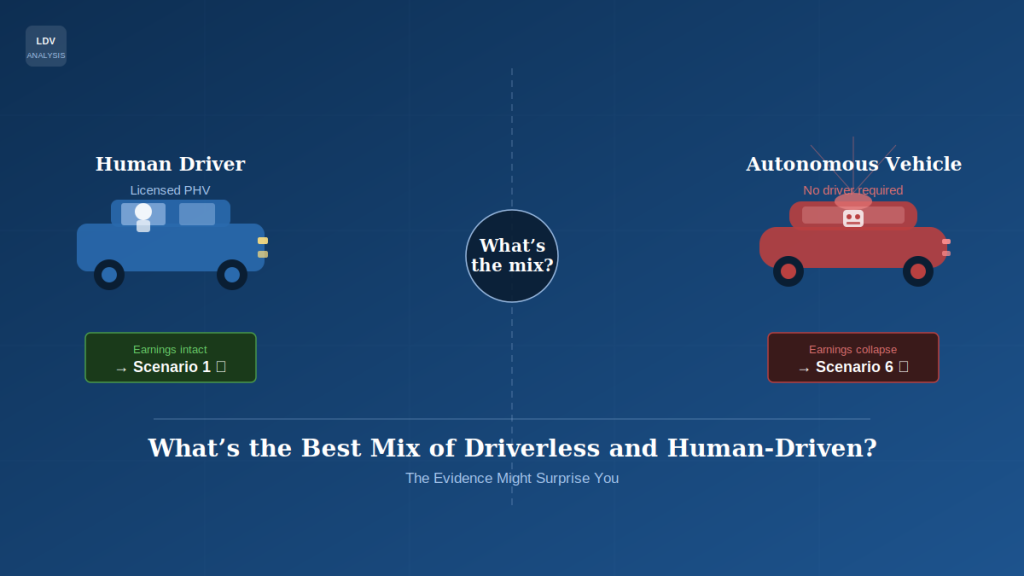
What’s the Best Mix of Driverless and Human-Driven? The Evidence Might Surprise You
From San Francisco’s hard data to academic game theory — here is what the research says about fleet composition, and what it means for every licensed driver in London.
|
5.3%
Trips-per-hour decline
in AV cities Q4 2025 Gridwise Analytics 2026
|
~10%
Year-on-year earnings
decline in Los Angeles Gridwise Analytics 2026
|
57–76%
Projected frontline job
reduction at full AV scale Academic consensus range
|
The Question Nobody in Government Is Asking
The debate about autonomous vehicles in London has been almost entirely about when — when will the first robotaxi launch, when will TfL approve a permit, when will driverless cars be a normal part of the city’s transport network.
The more important question — and the one with a direct bearing on the livelihoods of 110,000 licensed PHV drivers — is how many. What proportion of the fleet can be autonomous before driver earnings start to fall? Is there a ratio that works for everyone? And is anyone designing policy around that?
The evidence is building. And it tells a story that governments on both sides of the Atlantic appear to be ignoring.
What the US Data Already Shows
Gridwise Analytics, which tracks real-time earnings across rideshare platforms, published its 2026 fleet analysis covering cities where autonomous vehicles are already operating commercially — primarily San Francisco and Los Angeles, where Waymo has been running paid passenger services since late 2023.
The findings are stark. In cities with active AV fleets, trips per hour for human rideshare drivers fell 5.3% in Q4 2025 — compared to a 2.6% decline nationally. Los Angeles, where Waymo expanded most aggressively, saw a year-on-year earnings decline approaching 10%.
The mechanism is straightforward. When a platform can route trips to a vehicle that costs less to operate per mile than a human driver, that is where the work goes. Human drivers do not get fewer trips because passengers prefer robots. They get fewer trips because the dispatch algorithm is making economic decisions above their heads.
“Human drivers do not get fewer trips because passengers prefer robots. They get fewer trips because the dispatch algorithm is making economic decisions above their heads.”
The Academic Evidence: There Is a Tipping Point
A body of academic research has modelled what happens to human driver earnings as AV penetration increases across a shared platform. The findings converge on a consistent pattern: the relationship is not linear.
At low AV penetration — below roughly 5 to 10% of total fleet trips — human driver earnings are largely unaffected. The platform benefits from AV efficiency, but there is enough demand that human drivers fill the gaps, particularly in complex urban environments, bad weather, and accessibility trips that current AV technology handles poorly.
Beyond that threshold, the dynamic shifts. The platform gains pricing power it did not previously have. It can offer lower fares — undercutting its own human drivers on the same app — while maintaining margins through AV deployment. Human drivers face a choice between reducing their effective earnings per trip or losing trips to the algorithm entirely.
Game theory models of mixed-fleet platforms predict a race-to-the-bottom dynamic at scale. Once AVs represent a significant share of platform supply, the Nash equilibrium — the stable outcome where neither party can improve their position by changing strategy alone — involves platforms extracting maximum value from the AV fleet while human drivers compete at the margin. Worker earnings converge toward the minimum the platform is legally required to pay.
In the UK, that minimum is the National Minimum Wage — currently £12.21 per hour. After vehicle costs, fuel and insurance, many London PHV drivers are already below that figure. The research suggests AV competition makes that worse, not better.
The Five Scenarios: Ranked for Drivers
Drawing on the Gridwise data and the academic modelling, here is how different fleet compositions rank from best to worst for licensed PHV drivers.
| Rank | Scenario | AV share | Driver outcome | Notes |
|---|---|---|---|---|
| 1 | Human-only fleet with earnings floor | 0% | Best | Current London model. All trip revenue flows to human drivers. Earnings floor enforced by legislation. |
| 2 | Capped AV pilot with worker levy | Up to 5% | Manageable | AV operators pay a per-trip levy into a transition fund. Human driver earnings protected by a displacement guarantee. |
| 3 | Low AV penetration, no protection | 5–15% | Declining | Trip frequency falls for human drivers. No compensation mechanism. Equivalent to current San Francisco trajectory. |
| 4 | Mixed market, no cap | 15–50% | Serious harm | Platform pricing power entrenches. Human drivers pushed to off-peak and low-demand routes. Below-minimum-wage outcomes likely. |
| 5 | AV-majority market | 50–80% | Near-elimination | Human drivers restricted to niche routes. Earnings collapse. Most will exit the sector within 2–3 years. |
| 6 | Full AV replacement | 80–100% | Elimination | 57–76% job displacement (academic consensus). Remaining human trips: accessibility, corporate, specialist. Sector effectively gone. |
The Counterintuitive Finding
Here is what the evidence actually shows: a mixed fleet is not a compromise that works for everyone. It is the scenario that works best for platforms.
A pure human fleet gives drivers market power. A pure AV fleet removes them but at least forces platforms to invest in AV infrastructure. A mixed fleet does something worse: it allows platforms to use AVs as a pricing weapon against their own human workforce, while continuing to extract value from human drivers as a buffer for the routes, times and conditions that AVs cannot yet handle.
This is not a theoretical concern. It is already happening in Los Angeles. Gridwise’s data shows that the cities seeing the steepest human driver earnings declines are not the fully autonomous ones — they are the hybrid markets where AVs have reached critical mass but have not yet fully replaced human supply.
What This Means for London
London is currently in Scenario 1 — a fully human PHV fleet, prior to any commercial AV deployment. The Government’s APS application process opened on 22 May 2026. TfL has set five conditions for consent. The Automated Vehicles Act is in force.
If London moves directly from Scenario 1 to an unregulated mixed market — which is the default trajectory if no intervention occurs — the evidence points to Scenario 3 or 4 within three to five years. That means serious and accelerating harm to driver earnings, with no mechanism to compensate or protect the workers displaced.
The policy ask is not complicated. It is Scenario 2: a capped pilot, a per-trip levy, and an earnings floor. All three are achievable through existing regulatory instruments — the Automated Vehicles Act, TfL’s licensing conditions, and secondary legislation on worker protections.
What is lacking is not the legal framework. It is the political will to use it.
Sign the petition before 17 June
UK Parliament petition 751258 calls for a halt to driverless car deployment until protections are in place. It needs 10,000 signatures for a mandatory government response. The deadline is 17 June 2026.